01
Metrics with a stated formula
MER is net store revenue divided by total ad spend for the same period and timezone. CPA names its target conversion. Gross revenue is a separate, clearly named variant.
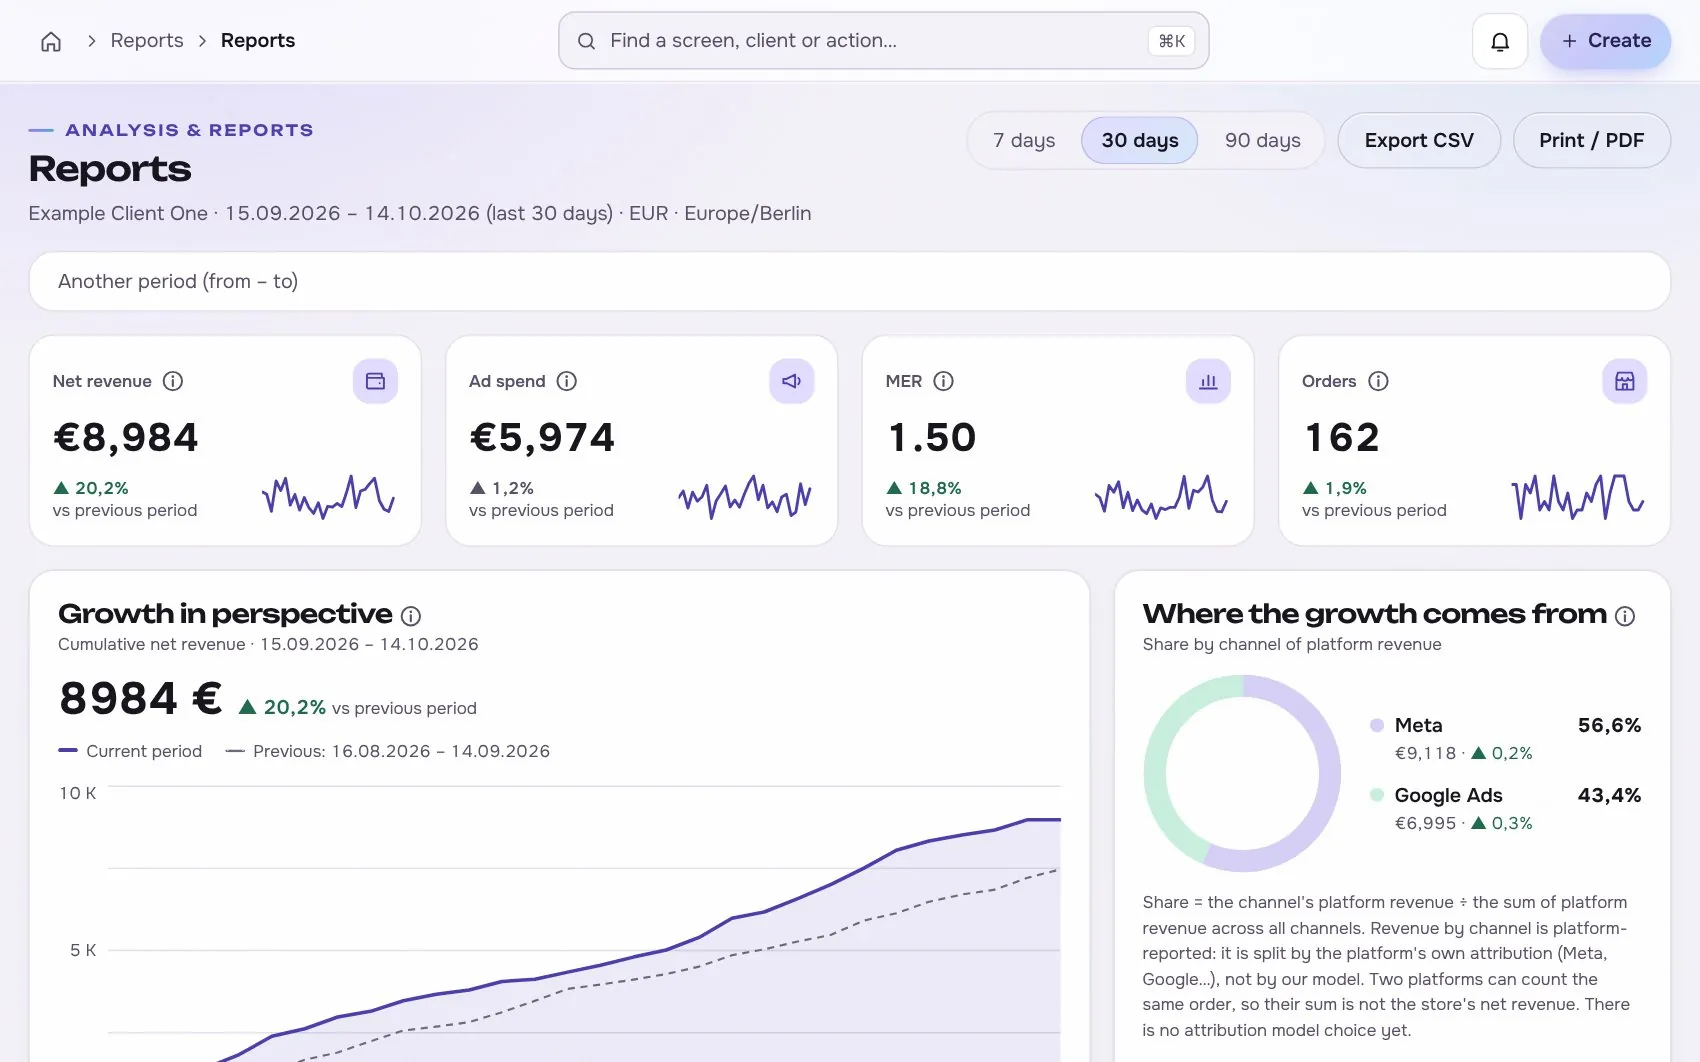
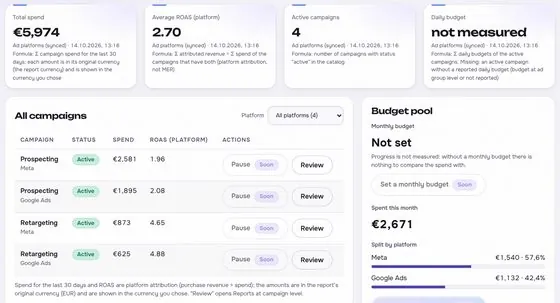
MER, blended CAC, CPA and platform ROAS by client, channel, campaign, ad set, ad and product. The store is the source of truth for orders and each platform keeps its own attribution.
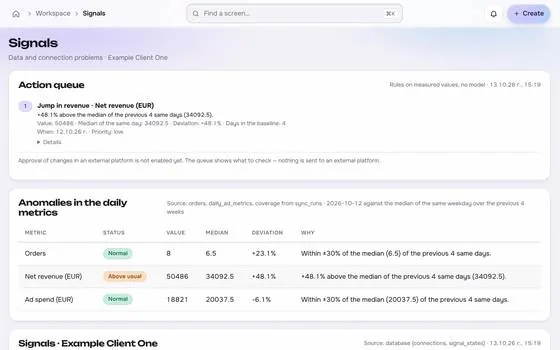
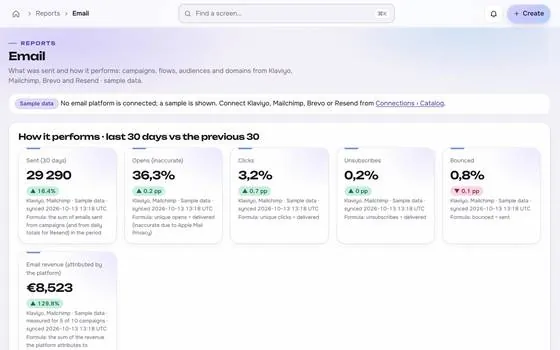
Floating cards and figures are examples on sample data, not a customer account.
One of four areas of the product, sharing the same client record, roles and log.
MER is net store revenue divided by total ad spend for the same period and timezone. CPA names its target conversion. Gross revenue is a separate, clearly named variant.
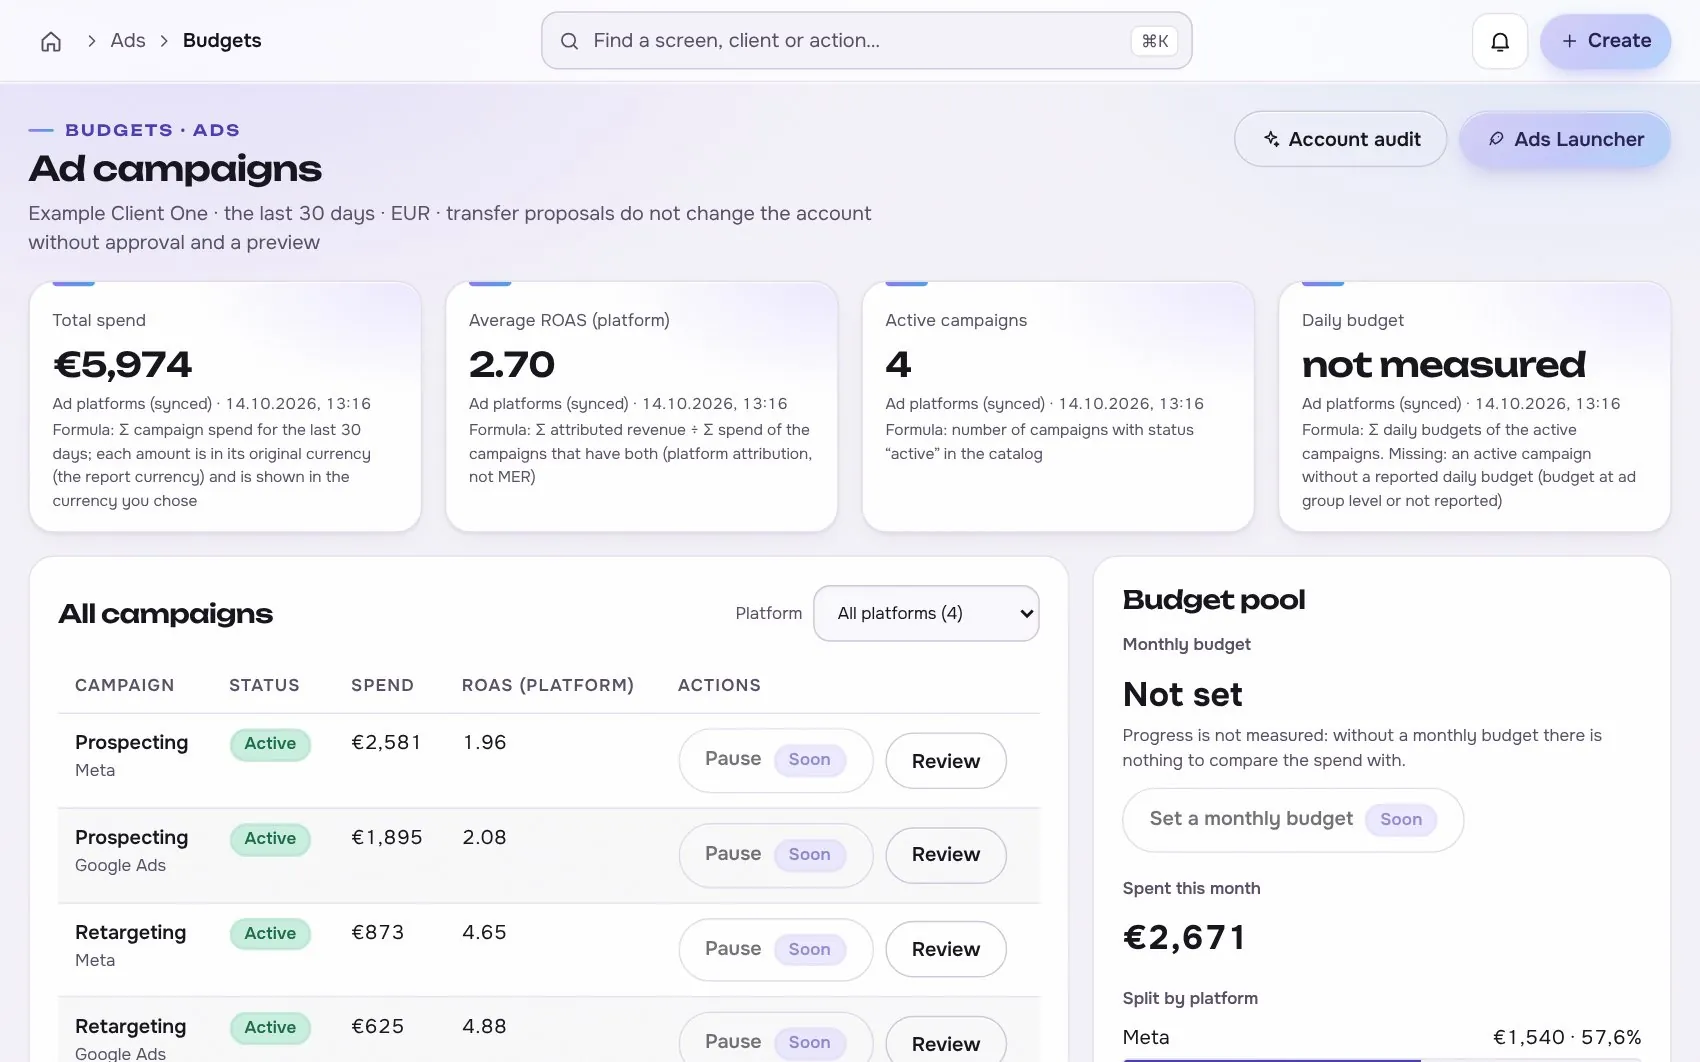
Meta, Google and TikTok attribute conversions differently, so each ROAS stays on its own row. Blended numbers such as MER and CAC come from the store.
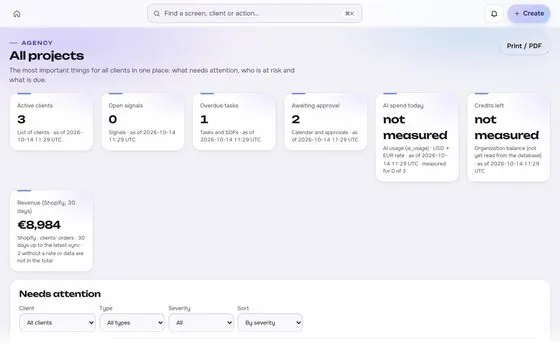
A source that is not connected shows as not measured, never as zero. That keeps MER from being silently inflated.
Connections start read-only. Writing is switched on per account, only after you grant the rights.





Lines draw as you scroll. Platforms on the left are read-only first, Reports sits on the one client record, and each output keeps its receipt.
ShopifyBuiltWooCommercePlannedMeta AdsBuiltGoogle AdsBuiltGoogle Analytics 4BuiltSources are read first, the numbers are stored once per client, and every output shows its source, formula and update time.
The same four moves apply to every module in this area.
From first connection to the number a client sees.
Store, ad accounts and analytics come in with read access first.
Orders and spend are normalised to one currency and timezone, with the original values and the rate kept.

Every number carries its source, formula and last update.
Send a report or give the client a link to the same numbers.

Photos are stock images that show the kind of business this is built for. They are examples, not customers.




Stock photos and example labels, not customers.
Connections are read-only first and go live only after the platform access is approved.
Built: the connector exists in the product and goes live per account once access is granted. Planned: not built yet.
Teams often use tools such as AgencyAnalytics or Triple Whale for this. Our comparison pages are drafts being verified.
Modules that share this client record, these roles and this log.